On-chain data shows Ethereum has successfully found a rebound at a major support zone, a positive sign for the asset’s exploration at higher levels.
Ethereum Recently Made A Retest Of A Strong On-Chain Support Zone
In terms of on-chain analysis, the potential of any particular price range to act as support or resistance lies in the total number of investors who bought their coins inside said price range.
The reason behind that is the holders are more likely to react whenever the price retests their cost basis or acquisition price, which is obviously an important level to them since it can flip their profit-loss situation.
A single holder showing such a reaction won’t cause any effects on the market, naturally, but if a large number of investors share their cost basis inside a tight range, the asset’s retest of the range could perhaps produce a sizeable reaction.
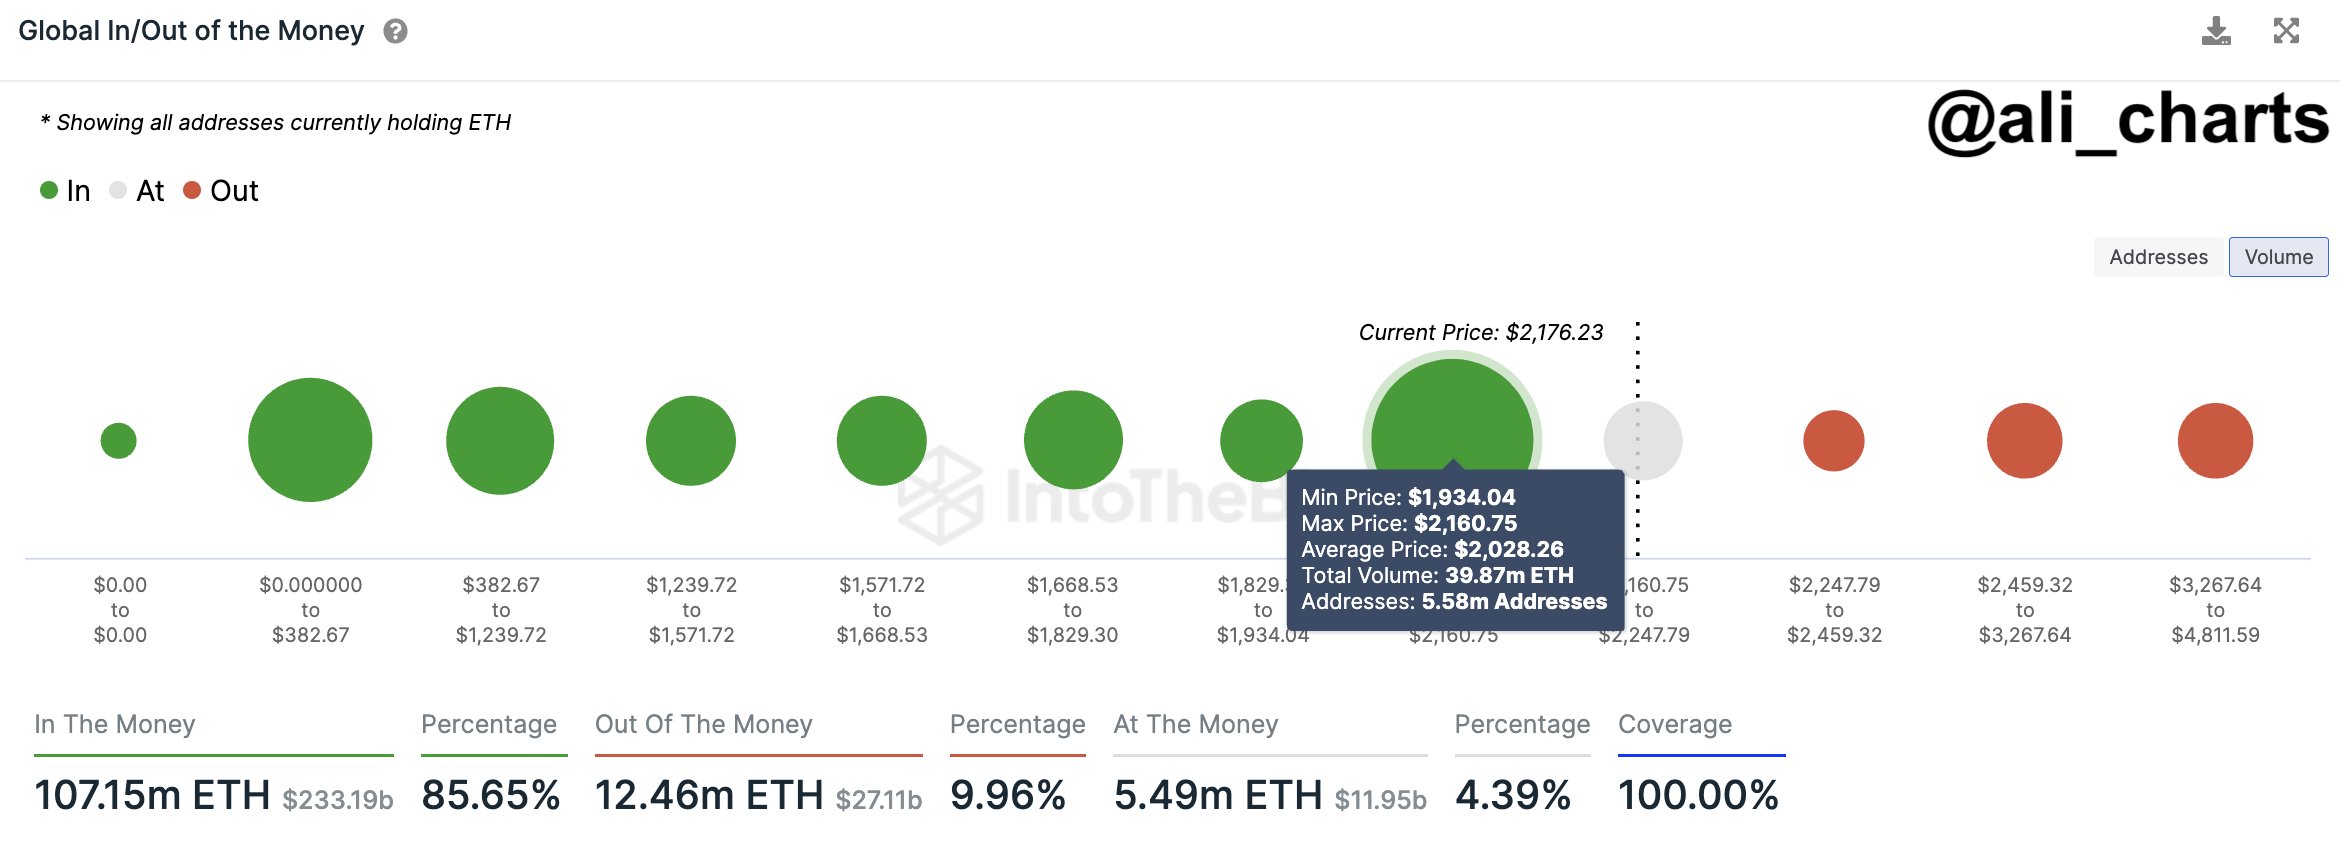
Hence, the larger the concentration of investors inside a particular range, the higher the ability of said range to act as resistance/support. Analyst Ali shared this chart recently in an X post that showed how the various Ethereum price ranges looked like in terms of the amount of addresses who acquired their coins at them at the time of the post:

The various on-chain support and resistance levels | Source: @ali_charts on X
From the graph, it’s apparent that the $1,934 to $2,160 range is the Ethereum range that hosts the cost basis of the most amount of addresses. At the time Ali had made the post, Ethereum was retesting this range.
Now, since this range has such a high number of investors, a retest of it is probable to cause some reaction on the ETH price. But what kind of reaction would it be, support or resistance?
What decides this is the direction the price is retesting from. If the retest is from above, that is, these investors had been in profit just before the retest, then the market could feel some support.
This is because the holders might think this same price range could be profitable again in the future, so they might decide to participate in some accumulation at it.
Similarly, a retest from below could end up leading to resistance for Ethereum, as the investors might fear the asset dropping once more, so they could become more likely to sell.
Therefore, this huge range holding the cost basis of 5.85 million addresses should have acted as support for Ethereum during its latest retest. And indeed, since the retest, the asset has successfully found a rebound, as it has shot up towards higher levels.
As is visible in the chart, the ranges ahead up to the asset’s all-time high are all relatively thin with investors. This means that, thanks to the large support basis below, ETH shouldn’t have too much trouble traversing through these levels, at least in theory.
ETH Price
Since finding the rebound at the support range, Ethereum has climbed towards the $2,300 level.
Looks like ETH has been going up during the last couple of days | Source: ETHUSD on TradingView
Featured image from Bastian Riccardi on Unsplash.com, charts from TradingView.com, IntoTheBlock.com
Disclaimer: The article is provided for educational purposes only. It does not represent the opinions of NewsBTC on whether to buy, sell or hold any investments and naturally investing carries risks. You are advised to conduct your own research before making any investment decisions. Use information provided on this website entirely at your own risk.


